[Git] Graph file count vs time
There are several projects to generate complete statistics of a Git repository, but sometimes, you just need something fast and simple.
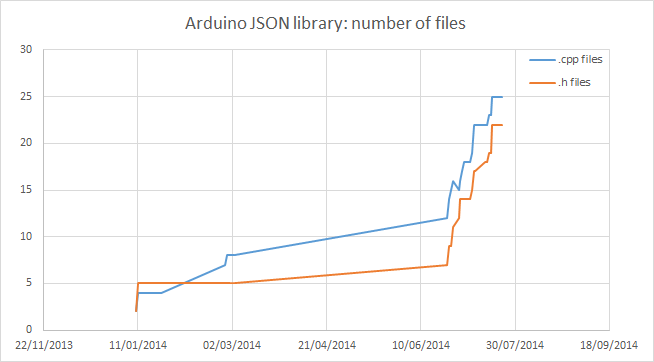
In my case, I just wanted to plot the number of files in a repository, each days since the day 0.
This is done very easily with the command git ls-tree that returns the list of files in the repository. Then it’s just a matter of filtering the results with grep and counting the lines with wc. All the data ends up in a CSV file.
Enough talking, here is the script:
#!/bin/bash

OUTPUT=stats.csv

# create output file with a CSV header
echo "date;.cpp files;.h files" > $OUTPUT

# function that counts files matching the specified regex
count() {
    git ls-tree -r --name-only $COMMIT | grep -e $1 | wc -l | sed 's/ //g'
}

# for each commit in log
git log --pretty="%H %cd" --date=short | while read COMMIT DATE
do
    # skip commits made on the same day
    [ "$PREV_DATE" == "$DATE" ] && continue
    PREV_DATE="$DATE"

    # count files
    CPP_FILES=$(count ".*\.cpp$")
    H_FILES=$(count ".*\.h$")

    # print to console
    echo $DATE
    echo " $CPP_FILES	.cpp files"
    echo " $H_FILES	.h files"

    # append to CSV file
    echo "$DATE;$CPP_FILES;$H_FILES" >> $OUTPUT
done
And this is the result for Arduino JSON library: